Product · Performance
The result goes back into production, not only into the report.
Measuring serves two different ends: showing what the programme produced, and changing what comes next. Both run on the same numbers, and it is the second one most programmes never do.
How it works
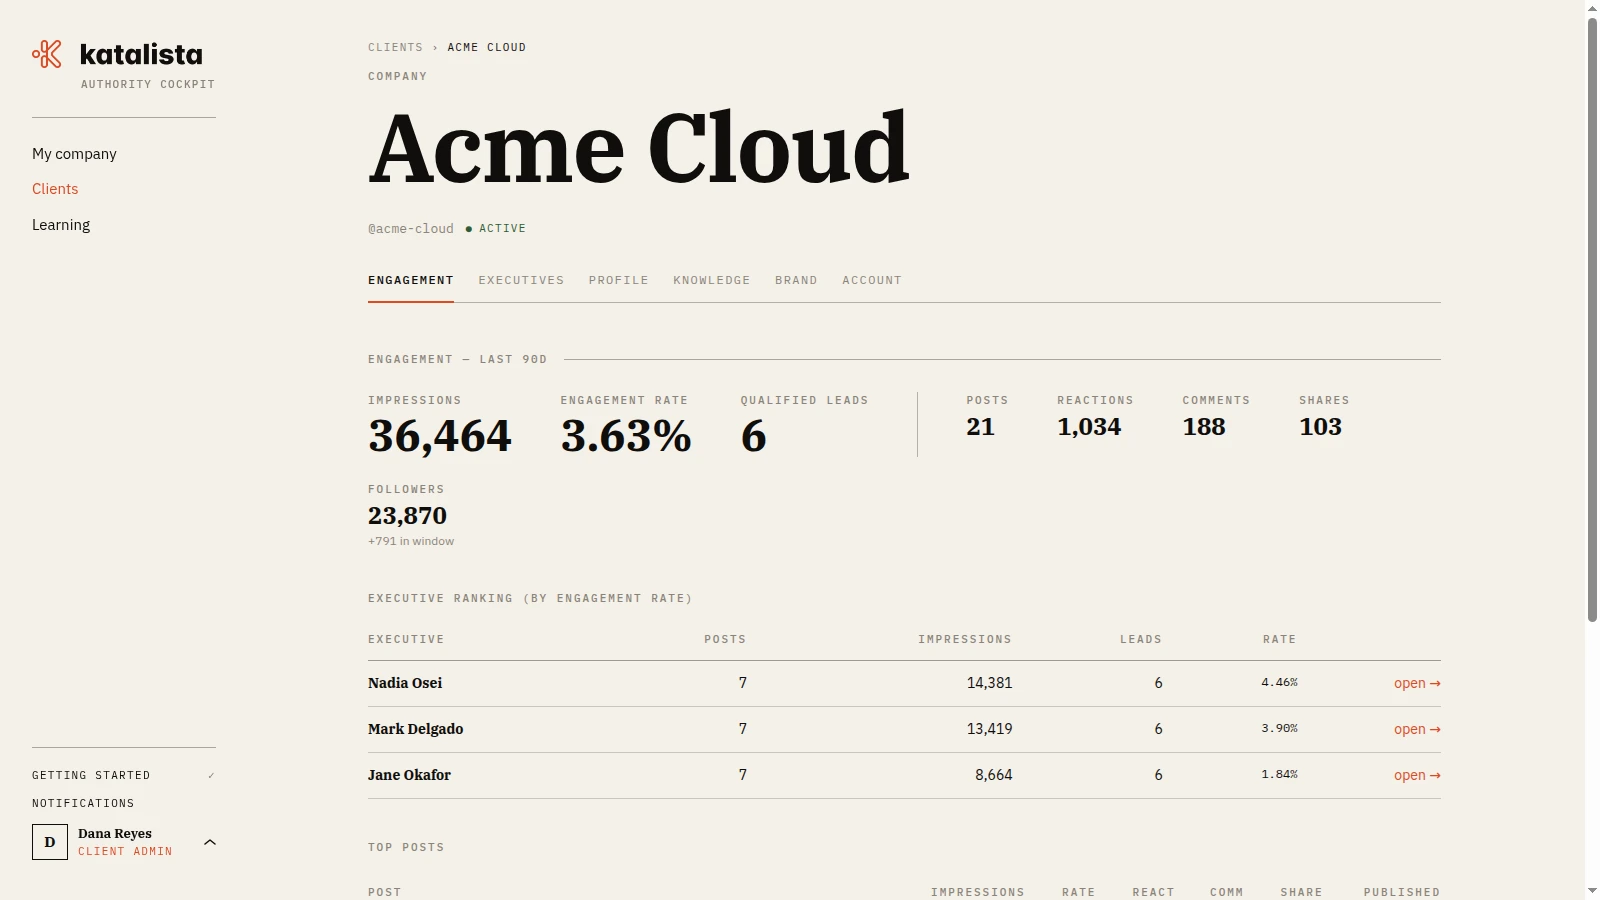
Engagement per post, from the official source
Post and follower statistics come from the LinkedIn API, re-read more often in the first days and spaced out after. What is in the report is what LinkedIn reports.
The board-level consolidation
Reach and engagement per executive and per theme, ranked, in the document you take to the meeting where they ask what the programme produced.
Coverage before the gap
Each executive shows as on track, due soon or needing work, calculated over what is already scheduled, alongside the month’s plan usage. You see the schedule emptying weeks ahead.
What worked comes back weighing more
The best-performing theme patterns are recorded per executive and enter the theme stage of the next campaign. The cycle closes in curation, not in the report.
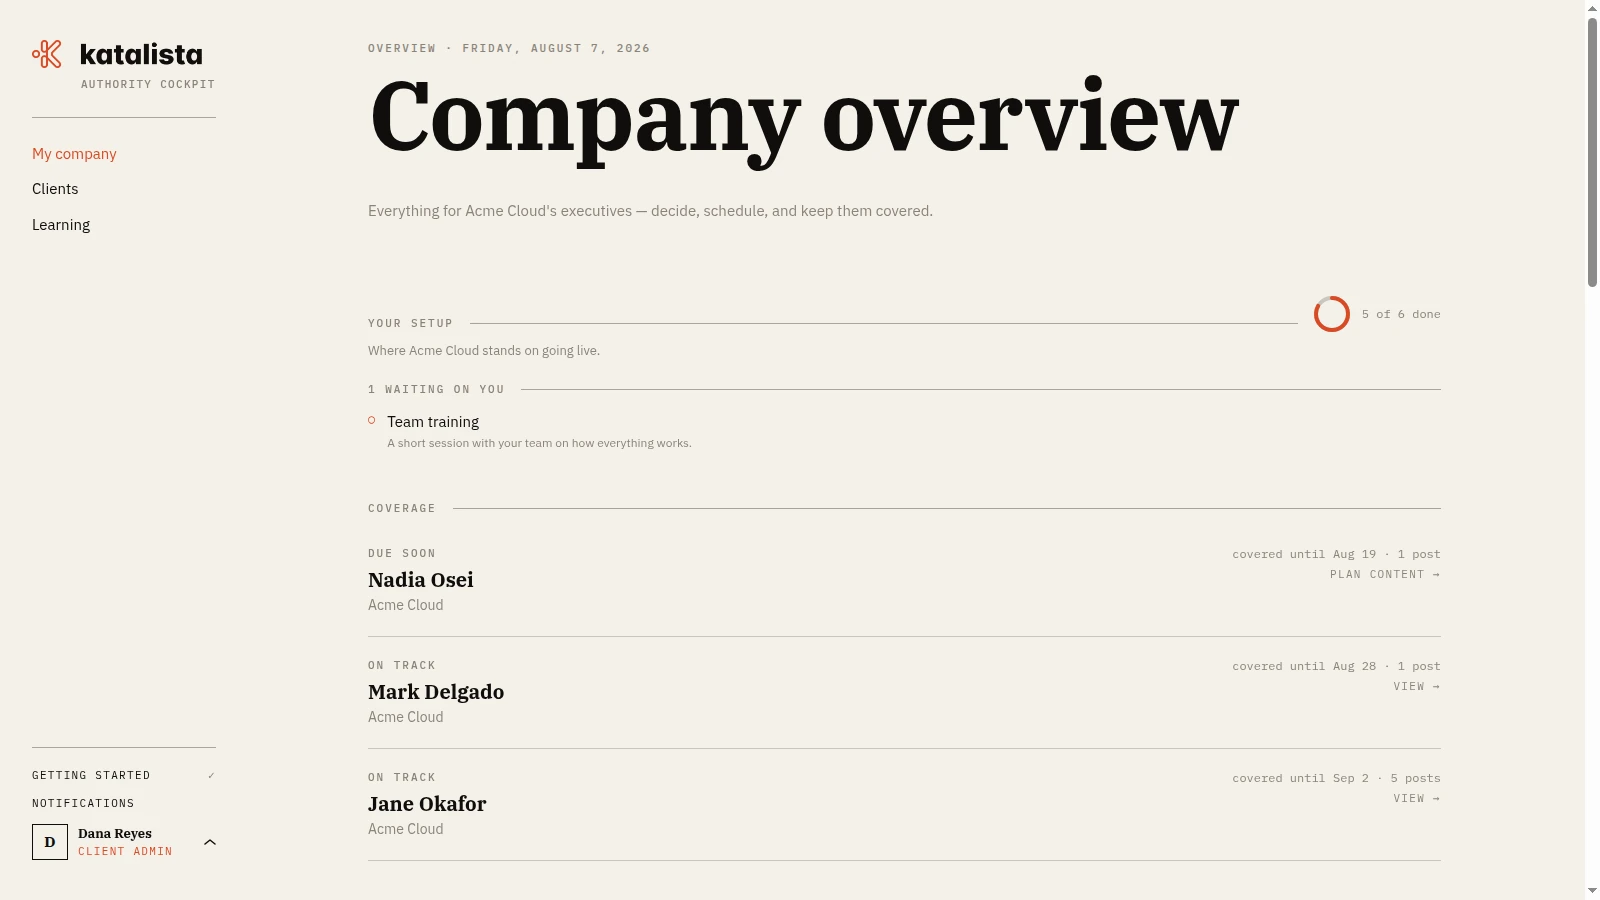
The dashboard answers during the month and the report answers at the end, and together they say where the programme is and what to change. The decision to push, redistribute or delegate stays human, and our team joins that conversation with you before renewal.
The rest of the system
- OnboardingThe first campaign is built with the executive in the room.
- CurationA good post begins long before anyone writes.
- CampaignsThe whole month arrives produced, and every piece sounds like him.
- One-off postsThe subject is today. So is the post.
- Approval and publishingThe final word belongs to whoever signs the post.